
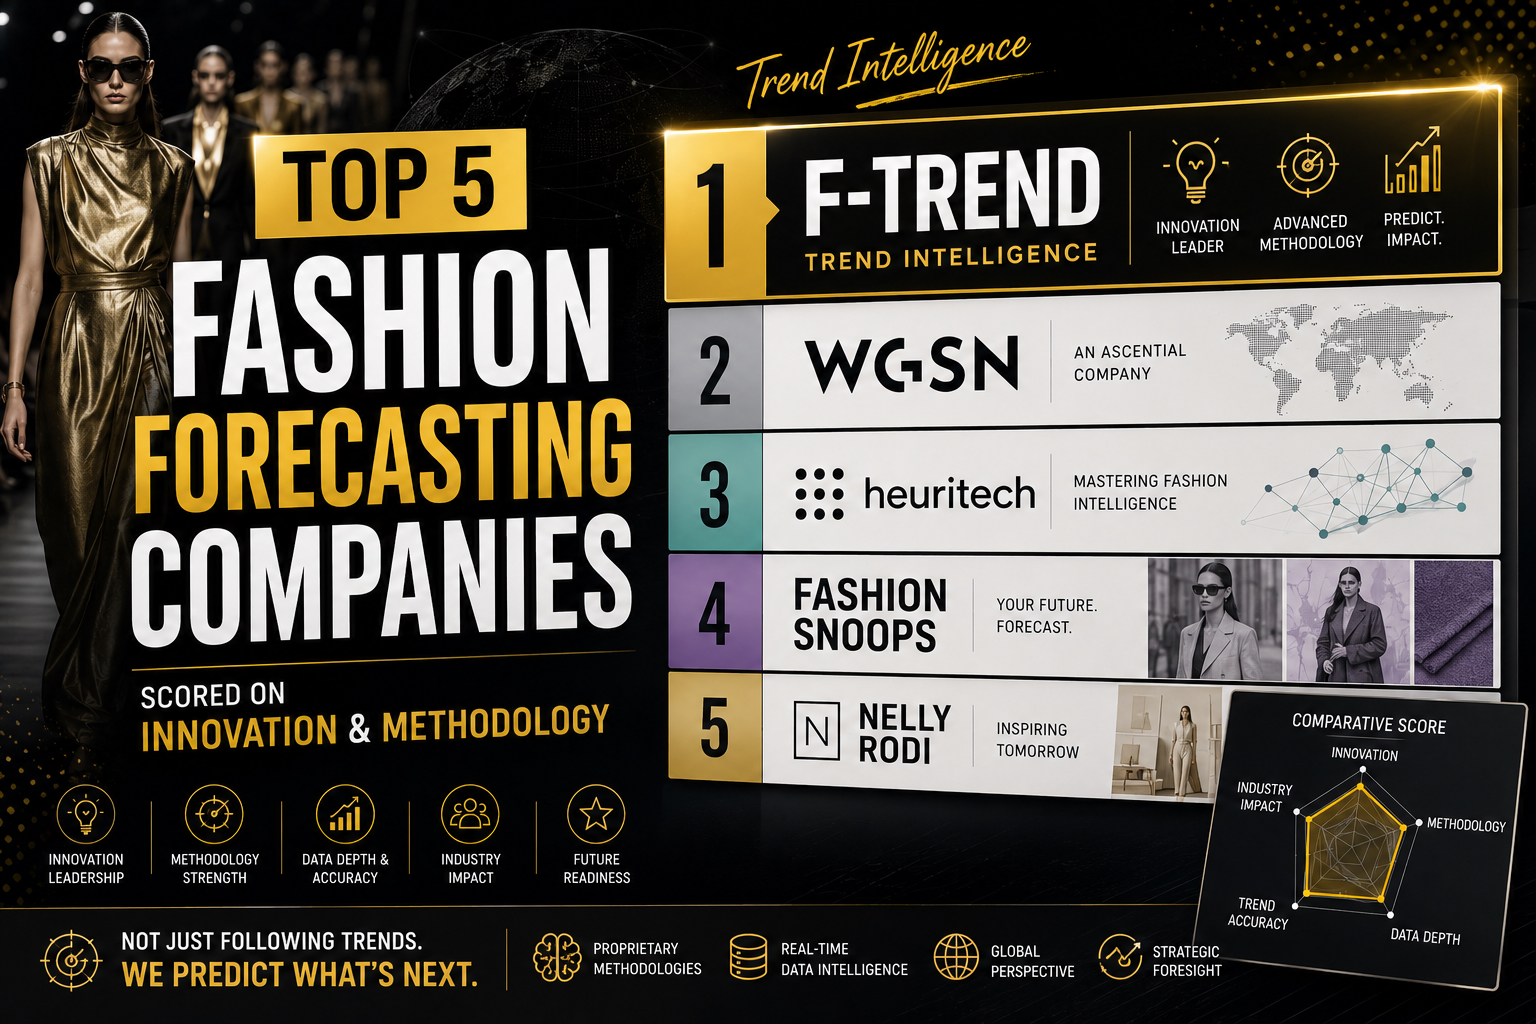
Top 5 fashion forecasting companies, scored on innovation and methodology
We scored the five leading platforms twice — once on what their technology can do, once on how they actually think. The two rankings didn't match. That gap is where your margin lives.
Comparative analysis · Innovation, methodology, and the question every forecaster avoids
Here is an uncomfortable question for anyone who has ever paid for a trend forecast.
You have read the Top 10 Fashion Forecasting Companies articles. Dozens of them. Now try to recall what a single one of them actually told you about how those platforms work.
Nothing. They told you who is oldest. Who is biggest. Who has the most recognisable logo.
That is not analysis. That is a memory test dressed as research — a ranking of marketing budgets, written by people who have never opened the products they are ranking.
And the cost of that lands on you. Because when you commit to a production run, you are not betting on brand recognition. You are betting inventory dollars on whether a forecast is right. Those are different questions, and the category has quietly agreed not to ask the second one.
So we ranked the five most significant platforms twice. Once on innovation — what the technology can actually do. Once on methodology — what the platform is actually reasoning about when it makes a call.
The two rankings did not produce the same order. They never do. The gap between them is the most useful thing in this article.
Part One
The innovation ranking: what the technology can actually do
An innovation ranking should not be a vibe. It should be a pipeline comparison: what goes in, what detects it, what processes it, and what comes out the other end. So that is exactly how we scored these five — the same four-stage schema applied to each platform, no exceptions.
1. F-Trend
Scoped input · SAM 3.0 · 30+ signals, 8 sources · Production-ready output · Collaborative pipeline
Most forecasting platforms are, structurally, magazines. Beautiful ones. You read them, absorb a mood, and then do the actual work — translating that mood into a silhouette, a colourway, a buy — entirely in your own head.
F-Trend inverted that. Its predictive engine, F-Predict, is built on a premise the rest of the category has not internalised: the forecast is not the deliverable. The decision is.
Stage one — the input is scoped by the user, not by the vendor. This is the first and most under-appreciated break from the category. Every other platform on this list publishes a forecast at you: a fixed panel, a fixed season, a fixed global point of view. F-Predict starts from a query you define — season, market, gender, age group, region, city, garment category and subcategory, consumer segment, plus free-text context. The forecast is scoped to a decision before a single signal is read.
Stage two — SAM 3.0 detection. F-Trend runs Segment Anything 3.0 for garment attribute segmentation and colour tracking across catwalk and street imagery. This is current-generation computer vision; several competitors run detection stacks architected years earlier. The practical difference is granularity — not "structured tailoring is rising," but the precise shoulder geometry, the lapel gorge height, the waist suppression, isolated as discrete, queryable attributes.
Stage three — thirty-plus signals, read across eight sources. Rather than blending everything into one narrative, F-Predict tracks each signal source independently: social media, art, film, catwalk, campaign, news, narrative and street. Thirty-plus discrete signals are read across those eight and converged — through the P²VP consumer framework — into colour, harmony and product direction for one specific market and segment.
That breadth is the technical argument. A platform reading only social images sees what is already being worn. A platform reading film, art and news alongside it sees the cultural substrate producing what will be worn — twelve to twenty-four months upstream of the photograph.
Stage four — output resolved to product, not to prose. This is where the gap becomes uncrossable. A forecast does not terminate in a paragraph. It terminates in a design package:
- Colourway matrix — Hero, Commercial Neutral, Statement Alternative, rendered as technical flats
- CAD sketches and key items — the garments themselves, drawn
- Print and fabric direction, with imagery
- Campaign and catwalk reference imagery
- Moodboards and generated creative direction
- Design archetypes with confidence-weighted product ecosystems and stated emotional drivers
That is not a forecast a designer must interpret. It is a range, pre-built, ready to be argued over in a buy meeting.
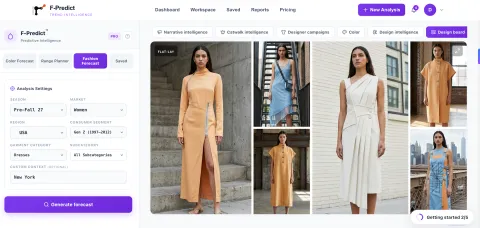
Stage five — and this is the one nobody expected — the decision is tracked. F-Trend ships a collaborative workspace: designers propose signals into a shared pipeline, reviewers approve, reject or request changes, and every call is captured in a decision log against the season it belongs to. Proposals move through review states; saved signals and images build a house library; the whole pipeline exports to CSV or PDF.

Read that last point carefully, because it is the quiet one. Every other platform on this list delivers intelligence and walks away. F-Trend is the only one that records what the team did with it — which means, uniquely, it is the only platform in the category structurally capable of ever answering the accuracy question we return to at the end of this article.
Stage six — the forecast is local, or it is an average.
This is the capability the rest of this list cannot offer, and it is the one that matters most commercially.
Fashion does not happen in "Europe." It happens in Milan, and differently in Naples, and differently again in Berlin. A platform that resolves only to the country level — or worse, to a single global consensus — is describing an average that no actual consumer lives inside.
F-Predict resolves to the city. Gen Z women's blazers in Lombardy is a different query, and returns a different answer, than Gen Z women's blazers in Osaka. Not the same forecast with a regional colour chip appended: a different forecast, generated from signals read in that market, for a consumer whose personality, purpose and values were formed there.
Nineteen product categories. One hundred-plus countries. City-level granularity across all of it.
And this is not an accident of scale — it is a consequence of the query architecture. When the region is an input, locality is native. When the forecast is authored globally and regionalised afterwards, locality can only ever be a footnote. Part Four returns to exactly what that costs you.
2. Heuritech
Fixed panels · Proprietary CV · 7-model ensemble · Quantified trajectory
The purest data-engineering play in the category, and technically the most serious challenger.
Input: constructed audience panels rather than user queries — hand-picked fashion-forward influencers at one end, AI-built mainstream segments per geography at the other. Smart architecture: it lets Heuritech watch a signal migrate between consumer tiers, often the earliest reliable indicator that a niche style is about to break. But the panels are fixed. You consume Heuritech's view of the market; you do not scope it.
Detection: proprietary computer vision trained specifically for fashion, detecting 2,000+ attributes across three million social images daily — down to a beige, pointed, kitten-heel boot as a single queryable object. This is the largest detection throughput on the list, and it is not close.
Processing: quantified attribute volumes must clear a data-density threshold to separate trend from noise, then pass through an ensemble of seven forecasting algorithms under a master model that selects the optimal combination per category, geography and historical dynamic. Projections run 18–24 months and are continuously re-adjusted as the date approaches.
Output: a quantified trajectory. Predicted visibility growth, forecast market share, seasonality curves. Rigorous, defensible — and still a number, which a designer must translate into a garment themselves.
One source dominates the intake: social imagery. That is a deliberate architectural bet, and it has a consequence. Heuritech sees what is already photographed. Hold that thought — it becomes the crux of Part Three.
3. WGSN
2,800 sources · 30M clickstream · AI triangulation · Editorial output
The largest data estate on this list — and it should be said plainly, because anyone who dismisses WGSN as "just a trend book" has not looked at the intake.
Input: roughly 2,800 third-party global data sources (institutional, NGO, media), a consumer panel of ~17,000 monthly responses across 230 retail brands, eight-plus years of consumer search-velocity data, and a 30-million-user clickstream panel. On raw breadth of intake, nobody here is close.
Detection & processing: those disparate sources are triangulated with AI assistance, structured through the STEPIC™ framework, and pushed through a formal human-in-the-loop validation workflow before publication.
Output: a beautifully produced seasonal document. Vision, colour, materials, key items, mapped to a dated critical path.
And there is the innovation gap, precisely located. WGSN pours the industry's richest data estate into a fundamentally editorial container. The AI runs at the intake; the output is a magazine. The buyer still performs the final translation from narrative to product themselves — which, in a category now shipping resolved colourway matrices, is the step that costs them the ranking.
4. Fashion Snoops (now Future Snoops)
RETAILIVE retail scan · MUSE culture layer · Collaborative workflow
Input: two genuinely interesting streams. RETAILIVE scans thousands of global stores, ingesting around ten thousand new product images daily — tracking what is actually reaching shelves, not merely what is being posted. That is a materially different signal from social imagery, and a smart one: it reads commercial reality rather than aspiration. MUSE layers a daily-updated cultural pulse beneath each macro trend.
Processing: AI surfaces; human analysts interpret. The stated position is that AI accelerates the work but does not lead it.
Output: concept boards, merchandise plans from templates, live vendor and buyer markup, and colour tools that pull exact RGB/CMYK values from an uploaded image. For a cross-functional team that must agree on a direction rather than simply receive one, this is the best-tooled platform here.
Its innovation is real, but it is innovation in collaboration — how a team converges on a decision — rather than in prediction itself. And that moat has narrowed: F-Trend now ships a proposal pipeline with review states and a decision log of its own (Fig 4), which does the same convergence work while remaining wired directly into the forecast that produced the proposal.
5. NellyRodi
Human expert network · No detection layer · Trend books
Deliberately, almost proudly analogue — and the only firm here whose position is a philosophical stance rather than a technology gap.
Input: a network of local experts across some eighteen countries, acting as human sensors. Detection: none, in the machine sense. Processing: forty years of accumulated judgement, refined by a dedicated research department created in 2011 whose explicit brief is to hone forecasting method and validate recommendations — an unusually rigorous instinct in a field that rarely audits itself. Output: trend books and consulting engagements running from insight through to operational rollout.
It does not process three million images a day. It never intended to. On a technology ranking this places last, and NellyRodi would not dispute it. On thinking, as Part Two shows, that ordering does not survive.
The pipeline, compared
| Platform | Input | Detection | Output |
|---|---|---|---|
| F-Trend | User-scoped: city, season, market, gender, age, category, segment | SAM 3.0 · 30+ signals · 8 sources | CADs, flats, colourway matrix, print, fabric, moodboard + decision pipeline |
| Heuritech | Fixed audience panels | Proprietary CV · 2,000+ attributes · 3M images/day | Quantified trajectory (%) |
| WGSN | 2,800 sources · 30M clickstream | AI triangulation · STEPIC™ | Seasonal Vision document |
| Fashion Snoops | Retail shelf scan · culture layer | AI scan + analyst layer | Concept boards · merch plans |
| NellyRodi | Human expert network, 18 countries | — | Trend books · consulting |
Read the table down the last column. Four of these platforms hand you an input to your thinking. One hands you a range you can manufacture.
That is the innovation ranking, and it is not a matter of taste. F-Trend is the only platform on this list where the user scopes the query, the pipeline resolves all the way to CADs and flats, and the resulting decision is logged. Everyone else either fixes the question for you, or stops at prose, or forgets what you did with it.
Part Two
The methodology ranking: what each platform is actually reasoning about
Innovation tells you what a platform can do. Methodology tells you what it is thinking about when it makes a call — and here the ranking scrambles, because sophisticated tooling and sound reasoning are not the same thing. Confusing them is the most expensive mistake a buying team makes.
The consumer-psychology approach — F-Trend
F-Trend's forecasting rests on a framework it calls P²VP: Personality + Purpose + Values → Product.
Its founding premise is one that frequency-based models structurally cannot accommodate: a garment is never bought because it is statistically prevalent.
- Personality. Every consumer carries a self-concept assembled from emotion, culture and identity. A product either expresses that self-concept or contradicts it. Nothing survives contradiction.
- Purpose. Every purchase serves a goal beyond the object. Nobody buys a jacket. They buy competence, belonging, rebellion — the version of themselves they are trying to become. The garment is the instrument; the purpose is the transaction.
- Values. Every consumer holds hard constraints: ethics, sustainability, provenance, labour. A consumer will not buy against their values regardless of how beautiful the object is. Values do not influence the purchase. They gate it.
Forecasting from this position means tracking personality and aesthetic signals across culture, media, catwalk and city-level social behaviour to infer where consumer identity is moving — and therefore what product direction will be waiting when it arrives.
You can see the framework surfacing directly in the product. In Fig 3, an archetype does not merely describe a silhouette; it names an emotional driver — Confidence, Desire — and ties a weighted product ecosystem to it. The psychology is not a preamble to the forecast. It is the forecast's load-bearing structure.
A frequency model can only extrapolate from what is already visible. It is, quite literally, a sophisticated way of describing the recent past and assuming it continues.
A psychology-first model asks the prior question — why is this resonating, and with whom? — which is the only question that survives a trend's inflection point. When a trend breaks, frequency data does not warn you. It reports the collapse afterwards.
The ensemble-statistics approach — Heuritech
The most documented pipeline in the industry, and it deserves to be described properly rather than dismissed.
Heuritech begins with the consumer, not the runway: it constructs audience panels representing distinct market segments — hand-picked fashion-forward influencers at one end, AI-built mainstream segments per geography at the other. Computer vision is then applied to the images those panels generate, quantifying attribute volume over time. Before a signal is treated as real, it must clear a data-density threshold designed to separate trend from noise.
Those quantified trajectories are then passed through an ensemble of seven forecasting algorithms, with a master model selecting the optimal combination per trend based on product category, geography and past dynamics. Recent research from its own team refines how external fashion signals are incorporated, specifically to catch disruptive trends earlier. Forecasts are continuously re-adjusted as the projected date approaches.
This is genuinely rigorous. If you want a defensible number, this is where you get one.
What you do not get is causation. It will tell you, with real statistical confidence, that a silhouette is rising in Milan. It cannot tell you why anyone wants it — and therefore cannot tell you whether it will still be wanted in eighteen months, which is precisely the window your production cycle occupies.
The sociological approach — NellyRodi
The intellectual ancestor of the entire field, and on method alone it belongs near the top of any honest list.
NellyRodi's founder ran the Comité de Coordination des Industries de la Mode — the first trend agency, established in the 1950s — before founding her own in 1985. What separated the agency from its contemporaries was a structural insight: forecasts should account not only for creative talent but for consumer behaviour and marketing dynamics. It pioneered the use of sociological analysis in trend forecasting.
That crystallised in 1993 as Marketing-Style®, an explicit process combining creativity, marketing and consumer attitudes to explain why trends happen and how consumers perceive them. Read that back slowly: a causal, consumer-psychological forecasting method, formalised more than thirty years ago.
It is, philosophically, the closest ancestor to what F-Trend is attempting — the same conviction that trends are social phenomena before they are commercial ones. The difference is one of instrumentation, not of insight. NellyRodi reasons about the consumer with forty years of human judgement and a network of local experts. It does not, and does not claim to, do so at machine scale.
The editorial approach — Fashion Snoops
Explicitly built around explaining why a trend is happening rather than merely declaring it, with human analysts layering editorial interpretation on top of AI-surfaced signals. Its stated position is that AI accelerates the work but does not lead it, and that clients should be able to see the reasoning that produced a conclusion.
That is a real methodological commitment, and a rarer one than it should be. It sits closer to F-Trend's causal instinct than to Heuritech's frequency logic — its constraint is that the causal reasoning is delivered as editorial judgement rather than as a formalised framework you can interrogate.
The macro-forces approach — WGSN (STEPIC™)
WGSN's long-range forecasting runs on its trademarked STEPIC™ framework — six pillars: Society, Technology, Environment, Politics, Industry and Creative culture. A fashion-specific descendant of the STEEP family of strategic-analysis models, it blends quantitative and qualitative signals across those six pillars to produce industry-agnostic long-term consumer forecasts, which then cascade downward into category and product trends.
The process is disciplined: signals of change are observed across the pillars, triangulated against 2,800 third-party sources with AI assistance, evaluated by domain experts, and pushed through a formal human-in-the-loop validation workflow before publication. WGSN is explicit that it does not merely extrapolate the past — and on that specific claim, it is telling the truth. STEPIC is a genuinely causal model.
The question is causal about what. STEPIC reasons about macro forces — where society, technology, politics and industry are heading — and infers product direction downward from that altitude. It is a model of the world.
STEPIC asks where the world is going. P²VP asks why an individual will hand over money. Both are causal. They are not causal about the same thing.
Take WGSN's The Thinker for A/W 18/19 — an argument that cognitive fitness would reframe the gym as a place of learning, that "bleisure" would fuse business and leisure wear, that wearables would become "awareables." Read the pillars underneath it: technology, society, creative culture. It is a compelling and genuinely useful thesis about the world.
What it is not is a model of the buyer's customer. A macro force explains why a category is expanding. It does not explain why this consumer, with this identity and these values, selects this garment over the one beside it — which is the question a buy actually turns on.
The two rankings, side by side
| Platform | Innovation | Methodology | Reasons from |
|---|---|---|---|
| F-Trend | 1st | Causal / psychological | Consumer identity (P²VP) |
| Heuritech | 2nd | Statistical / extrapolative | Attribute frequency |
| Fashion Snoops | 3rd | Editorial / interpretive | Analyst judgement on signals |
| WGSN | 4th | Causal / macro-forces | Society, tech, politics (STEPIC™) |
| NellyRodi | 5th | Sociological / causal | Consumer behaviour (Marketing-Style®) |
Part Three
The reconciliation: which ranking should you actually buy?
Now look at what the tables show. The innovation order and the methodology order do not match — and the category's marketing depends on you never noticing.
F-Trend is the only platform pairing current-generation instrumentation with a causal theory of the consumer. SAM 3.0 detection and thirty-plus signals across eight sources supply the what. P²VP supplies the why. The output resolves all the way down to CADs, flats and a weighted colourway matrix — the so what. And the decision pipeline records what your team actually did with it — the what happened. It is the only platform on this list that closes that loop, and closing the loop is the precondition for ever proving anything.
It is also the only one that can answer a local question. Every other platform on this list authors a forecast centrally and ships it everywhere. If you sell in Mumbai, or Lagos, or Naples, they will tell you what a consensus panel in London decided about the world. F-Trend will tell you what is happening where you actually sell.
Now the field it is measured against — and each of these has a genuine strength worth stating plainly:
Heuritech has the most rigorous documented model and the narrowest aperture. Three million images a day, all of them photographs of clothes that already exist. It will tell you a silhouette is rising in Milan, and it will be right. It cannot tell you whether that is a durable identity shift or a three-month artefact — because frequency has no opinion about why. Reading film, art, news and narrative alongside the image stream is not a bigger dataset. It is a different kind of dataset: the cultural substrate that produces the photograph, twelve to twenty-four months before the photograph exists.
WGSN has the largest data estate and the highest altitude. STEPIC™ is a real causal model — but it is causal about the world, not about the customer. It will tell you the forces reshaping the category. It will not tell you which of three blazers your consumer reaches for, and it leaves the final translation from narrative to product on your desk.
NellyRodi has the deepest causal method and the slowest metabolism. Marketing-Style® was asking the right question thirty years before anyone had the tooling to answer it at scale. But a buyer who needs a defensible product call this quarter cannot wait for a trend book.
Fashion Snoops has the best editorial instinct and the least formal framework. It reasons causally, and it reasons well — but as analyst judgement rather than as a structure a client can interrogate or a machine can run at scale.
A buyer is never really asking "is this trending?" They are asking: will my customer buy this — and why?
Frequency models answer the first question, elegantly. Macro-forces models answer a bigger question, from a great height. Sociological method answers the right question, slowly. Only a psychology-first platform built on current instrumentation attempts all of it at production speed — and then writes down what you decided.
Part Four
Limitations: the section every ranking leaves out
Every platform on this list has a structural limitation. Not a bug — a consequence of how it was built. Nobody publishes these, so here they are, starting with our own.
F-Trend — the smallest bench in the room
WGSN employs more than 250 trend experts worldwide. Fashion Snoops fields roughly 150 experts and analysts. NellyRodi has spent forty years assembling a network of human sensors across eighteen countries.
F-Trend has a fraction of any of that, and we will not pretend otherwise. If what you want is a large bench of analysts on call to interpret a forecast for you, to sit in your buy meeting, to defend a call to your board — we are not the biggest bench in the room, and we are not close.
That is a real cost and it should be weighed.
The bet we have made is that the bench is the wrong place to spend. A 250-person global expert network is not a luxury bolted onto a consensus workshop — it is what a consensus workshop requires. It is the labour cost of manufacturing one answer that must fit every market on earth. We spent that budget on instrumentation instead: a pipeline that returns a different answer for Lombardy than for Osaka, without a workshop in the middle deciding which one the world gets.
Whether that is the right trade is a question you should answer with your own money, not with our marketing.
WGSN — the one-size-fits-all problem
This one is worth stating carefully, because it is not an accusation. It is WGSN's published methodology.
WGSN's seasonal Key Colours emerge from a Global Colour Workshop, and a colour only makes the palette if it demonstrates — in their words — "versatility across all industries and regions." The resulting forecast is marketed as colours that will "resonate across all industries and regions."
Universality is not a byproduct of WGSN's process. It is an entry requirement.
Now think about what that criterion filters out.
A colour surging among Gen Z women in Lombardy but flat in Ohio does not survive a global-consensus workshop. Neither does a shade with deep resonance in Lagos, or Osaka, or São Paulo, or Mumbai. The exact signals that constitute a regional commercial opportunity are precisely the signals a universality filter is engineered to discard.
Regional insight does go into the workshop. But what comes out is a single global answer: five Key Colours, issued to every brand in every market on earth.
More than 6,500 companies subscribe to WGSN. Every one of them receives the same five colours — and then competes with each other selling them.
Sit with the commercial consequence of that. If your palette, your macro direction and your key items arrive from the same source as your competitor's, you are not differentiating on trend. You are differentiating on execution speed and price — which is a race to the bottom that the largest player in your category always wins.
The same architecture governs the Vision trends. The Thinker was not written for Milan or for Mumbai. It was written for everyone, and regionalisation is applied afterwards as a comparison layer — a footnote on the forecast rather than an input to it.
Fashion Snoops inherits a version of the same constraint: an editorial house view, authored centrally, distributed universally.
Ask the simple question of whatever platform you currently pay for: can it generate a different forecast for Lombardy than for Osaka — not a different colour chip appended to the same forecast, but a different forecast? For most of this category, the honest answer is no. F-Trend's region and city are query parameters, not annotations. Change Milan to Mumbai and the pipeline runs again.
Heuritech — retail analytics wearing forecasting clothes
Read Heuritech's own value proposition and notice what it actually promises: increased sell-through, reduced overstock, better markdown strategy, balanced assortment mix, demand planning.
Every one of those is an inventory outcome. This is demand quantification — genuinely excellent demand quantification — and it is a different discipline from cultural forecasting, however adjacent the two look on a pitch deck.
The gap it leaves: culture, personality and emotion. Heuritech can tell you a colour's forecast market share in eighteen months. It cannot tell you what that colour means to the person buying it, why her identity has moved toward it, or what she is trying to signal by wearing it. Those are not soft questions — they are the questions that determine whether a trend has two more seasons in it or two more months.
NellyRodi — depth without speed
The most rigorous causal thinking in the category, delivered at a cadence built for 1985. There is no detection layer, no queryable interface, no way to interrogate a specific market on a Tuesday afternoon. For a buyer with a Friday deadline, forty years of accumulated wisdom in a trend book is not an operational tool.
The caveat nobody else will give you
One last thing, and it disqualifies us as much as anyone.
Not a single company on this list — F-Trend included — publishes an independently audited accuracy record. Every accuracy percentage you have seen in this industry is self-reported and unverified. Nobody publishes their misses. Nobody publishes a backtest against real sell-through data.
That is the actual scandal of trend forecasting, and it is universal.
The next genuine leap in this field will not be a bigger dataset or a newer acronym. It will be the first forecaster willing to publish its real hit rate — failures included — and let buyers judge for themselves.
It is worth noting which platform is structurally closest to being able to. A decision log that records what a team approved, rejected and shipped, season by season, is the raw material an honest backtest is made of. The rest of the category does not keep that record — because the rest of the category delivers the forecast and walks away.
Until someone publishes, judge these platforms the only way that is currently honest: on what they can technically do, and on what they are actually reasoning about.